Report Screen Shots
| The following screen shots demonstrate some of the reporting
capabilities of Fund Manager. Fund Manager has 21
different report types. One of these is the "Custom"
report, where you can choose your own columns from a wide
variety of available fields. Reports can be sub-totaled
by: Sub-Portfolio, Investment Type, Symbol, Asset Type,
Investment Goal, Sector, or Currency. Reports can also be filtered
by Investment Type, Symbol, Asset Type,
Investment Goal, Sector, or Currency. Graph screen shots
are also available. To
read more details on any graph or report type, see the
documentation.
|
| Quick Jump: |
|
|
¹ = Advisor version only
² = Professional/Advisor versions only |
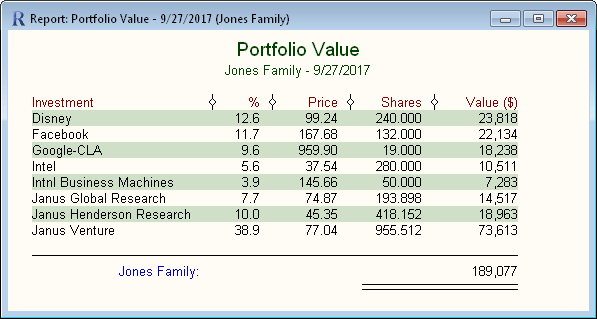
| Portfolio Value report listed by Investment |
| This report shows the value of each investment in the "Jones
Family" portfolio. Reports can be listed by
"Investment", "Symbol", "Investment Type", "Asset Type", "Investment
Goal", "Sector", or "Currency". [read more] |
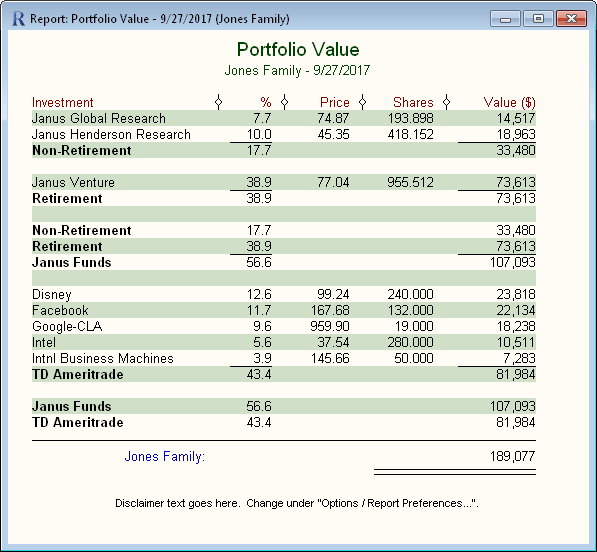
| Portfolio Value report sub-totaled by portfolio
with a disclaimer |
| Customizable disclaimers can be displayed in the
report's footer (Advisor version only). [read
more] Reports can be displayed flat, or sub-totaled by
Sub-Portfolio, Investment Type, Symbol, Asset Type,
Investment Goal, Sector, or Currency. This report is sub-totaled by Sub-Portfolio. You can have any
number of sub-portfolios, and they can be hierarchical. You can create
a report for any sub-portfolio, anywhere in the sub-portfolio hierarchy.
For example, you could create a report for just the "Janus"
sub-portfolio, and it would include the "Non-Retirement" and
"Retirement" sub-portfolios beneath "Janus", but it would not
include the "TD Ameritrade" sub-portfolio. [read
more] |
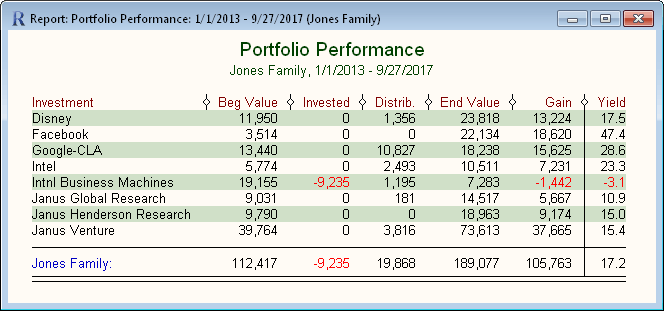
| Portfolio Performance |
| This report shows how well your invested money has
performed over the specified time period. Reports can be displayed
for any desired time period, and you can optionally have multiple date
ranges displayed within a single report. The "Yield"
column is the time and money weight Return On Investment (ROI)
yield. [read
more] |
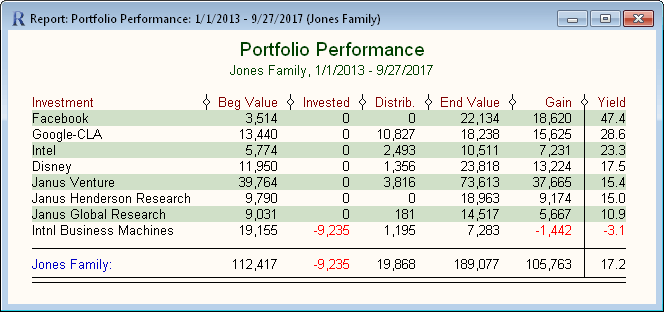
| Portfolio Performance sorted by Yield |
| Reports can be sorted by any displayed column, and
can be displayed in either ascending or descending order. This
report was sorted in descending order by the Yield column. |
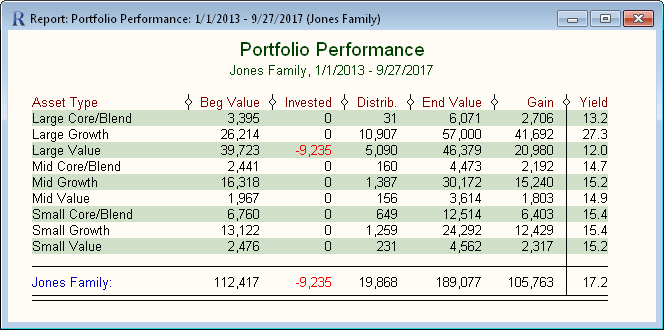
| Portfolio Performance listed by Asset Type |
| This demonstrates listing a report by "Asset Type", rather
than "Investment". Reports can be listed by Investment,
Symbol, Investment Type, Asset Type, Investment Goal, Sector, or
Currency. |
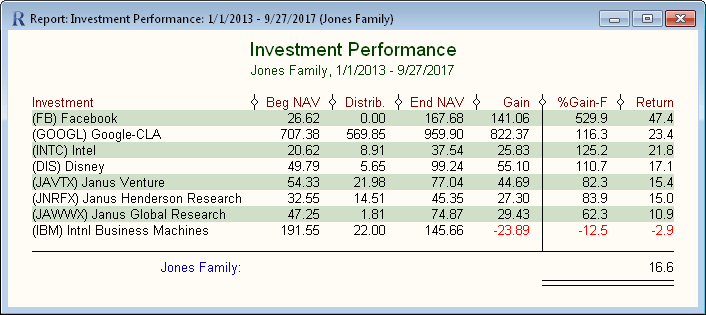
| Investment Performance |
| This report type displays the performance of the
underlying investments in your portfolio. The figures are based on
the share price of the investments, so you can see how well the
intrinsic investments performed, independent of when your money was
invested. The 'Return' column displays the true
Time-Weighted Return (TWR) of each investment, and the whole
portfolio. [read more] |
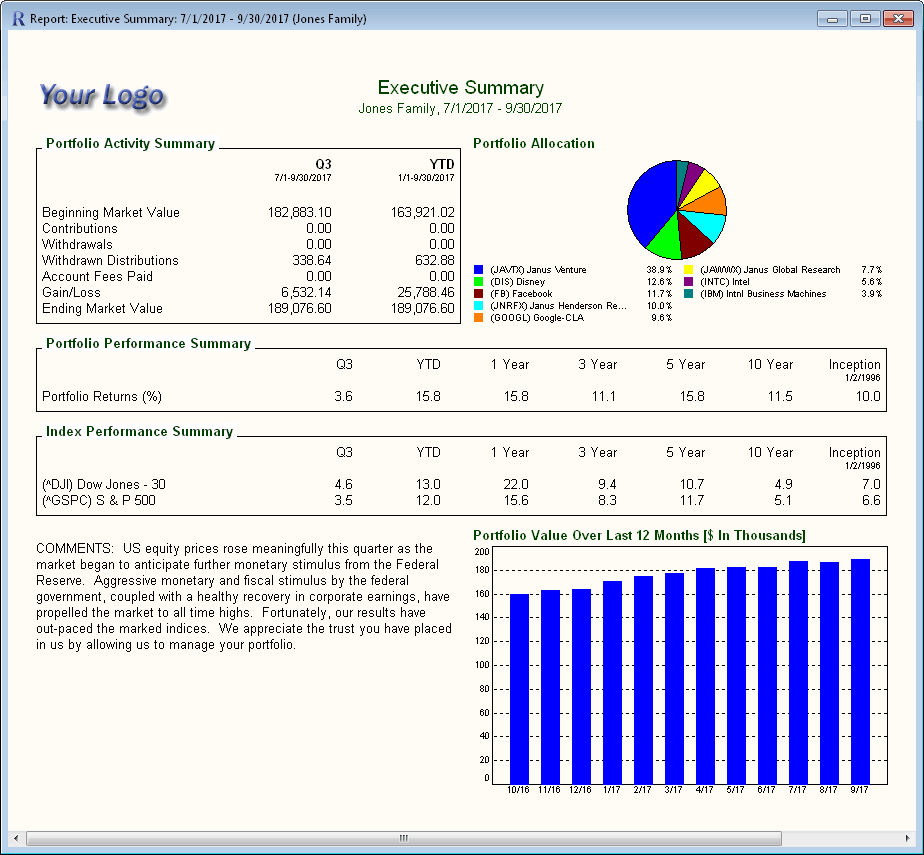
| Executive Summary |
| This report type displays a high level overview of an
account, along with a comparison to any set of indices you
select. The 'Portfolio Activity Summary' section shows the
starting balance, any money added or taken out, the gain/loss
and the ending balance. The 'Portfolio Allocation' pie
chart can be customized to display by top holdings, symbol,
investment type, asset type, investment goal, sector, sub-portfolio, or
currency. The 'Portfolio Performance Summary' section
shows Return on Investment (ROI) yields for the portfolio for
time periods you select. The 'Index Performance Summary'
displays Time-Weighted Returns (TWR) of the indices for the same
time periods, so a comparison can be made to the actual
portfolio returns. You can optionally insert comments and
plot any portfolio based graph. You can insert your own image to be
used as a logo on reports, as shown in this sample. Logos
can be displayed in the upper left and/or upper right corners. [read more] |
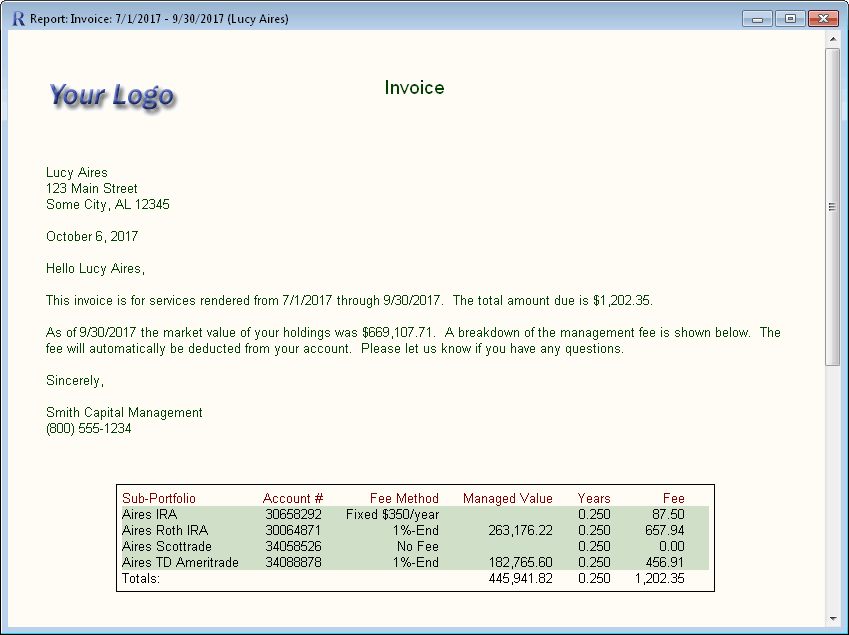
| Invoice |
| This report displays like a letter, with an optional
management fee summary along the bottom. The letter text
can be specified in the Report Preferences - Invoice Dialog.
A wide variety of fields can be inserted into the message text.
These fields are substituted with the appropriate values when
displaying the report. [read more] |
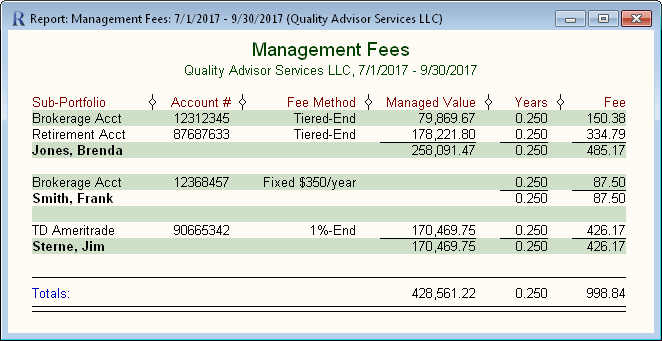
| Management Fees |
| This report is available in the Advisor version and displays
management fee details for each client. The advisor can
define any number of management fee methods and rules for
calculating the fees, and then assign this fee method to each
client's sub-portfolios. The report can optionally be
sub-totaled by client (as shown), or listed flat. Like all
reports, this report can be exported to a CSV file for
transmitting fee information to your broker/dealer. [read more] |
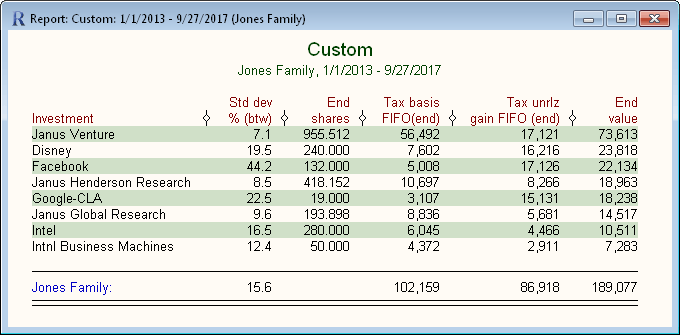
| Custom report |
| The custom report is the most flexible report in Fund
Manager. You can choose from a wide variety of available fields, and
display any columns you want, in any order. As with all reports,
you can adjust the title to display whatever you like. You can
also memorize any report, so it can be recalled easily. In
the Professional/Advisor versions you can define your own fields
using existing fields and equations. [read
more] |
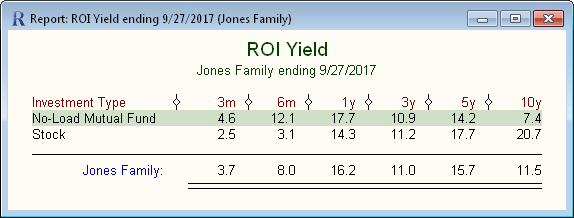
| ROI Yield report listed by Investment Type |
| This report calculates the ROI yields. ROI
yields factor in the time value of money, and how/when you invested.
The yield terms are adjustable. Yields can be calculated
for any investment, symbol, investment type, asset type,
investment goal, sector, currency, or sub-portfolio. By default, yield terms
less than 1 year are not annualized, and yield terms greater
than 1 year are annualized, but these are both adjustable. [read
more] |
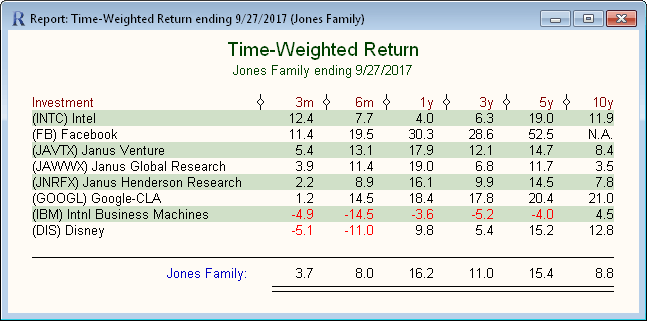
| Time-Weighted Return report listed by
Investment |
| This report calculates the true Time-Weighted Returns (TWR).
Time-Weighted returns ignore when
you added or removed money, so you can see how well the investments
and portfolio
performed, without considering your market timing. For an
explanation of the differences between ROI and TWR yields, see
Yield Calculations in the
documentation. [read more] |
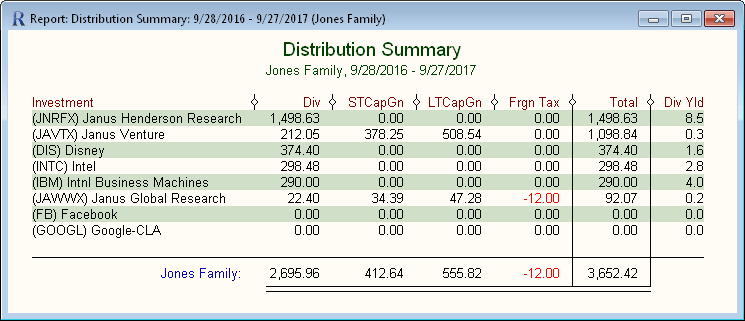
| Distribution Summary report |
| This report summarizes all the distributions received during
the report period. Fund Manager tracks 13 customizable
distribution types. (Only 4 are shown in this screen
shot). By default this report displays all distribution
types actually received. [read more] |
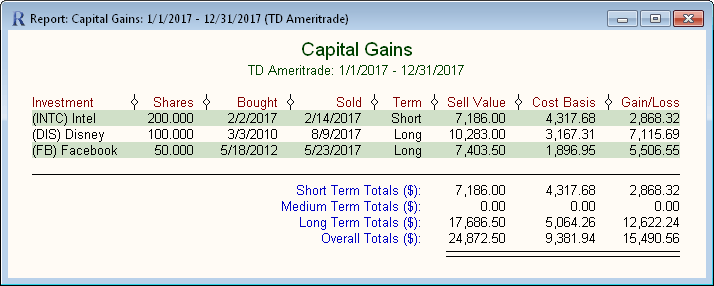
| Capital Gains report |
| Fund Manager makes tax time easy, by calculating
everything you need for capital gains reporting. Fund Manager
supports the First In First Out (FIFO), Average Cost (AVG), or Specific
Lot accounting methods. Capital gain information can be exported
to a Tax eXchange Format (TXF) file for importing into popular tax
preparation software. [read more]
The Professional and Advisor versions of Fund Manager
also support wash sales. [read more] |
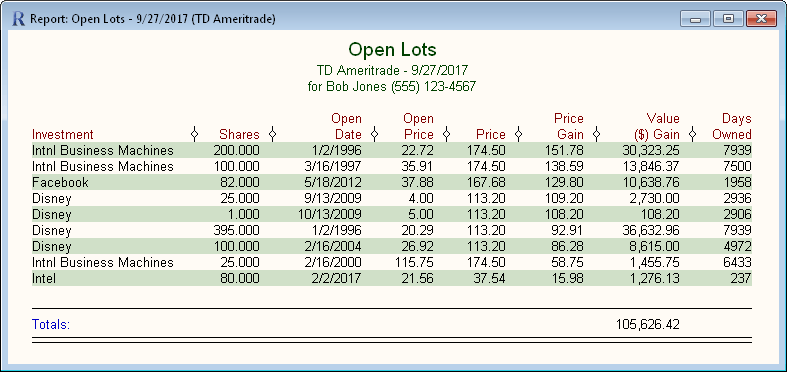
| Open Lots report |
| This report lets you quickly see the status of all your
currently owned shares. The displayed columns can be
customized to view a variety of information on these shares. [read more] |
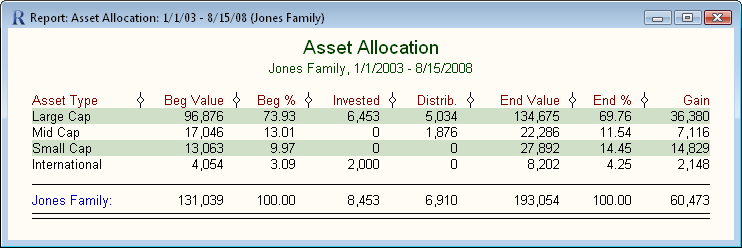
| Asset Allocation report |
| This report lists each asset type, and gives a summary of
how well it performed over the specified report period.
Each investment is assigned as percentages into one or more
asset types. Asset type assignments can be automatically
retrieved from the internet. There are 100 available asset types, and you can customize their names. [read
more] |
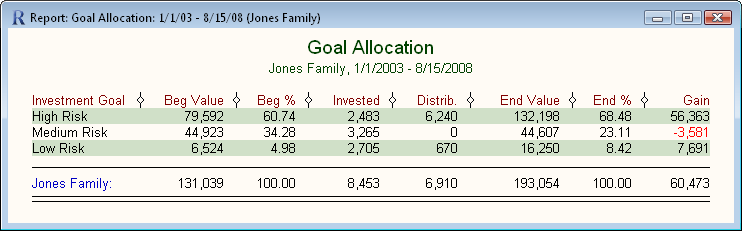
| Investment Goal Allocation report |
| This report lists each investment goal, and gives a
summary of how well it performed over the specified report period.
There are 100 available investment goals, and you can customize their
names. [read more] |
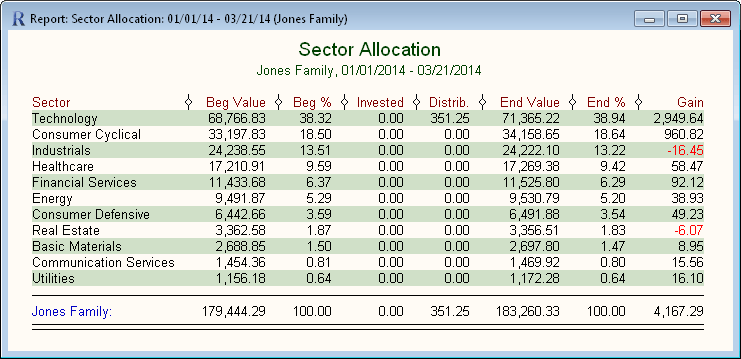
| Sector Allocation report |
| This report lists each sector, and gives a
summary of how well it performed over the specified report period.
Sector assignments can be automatically retrieved from the
internet. There are 100 available investment goals, and you can customize their
names. [read more] |
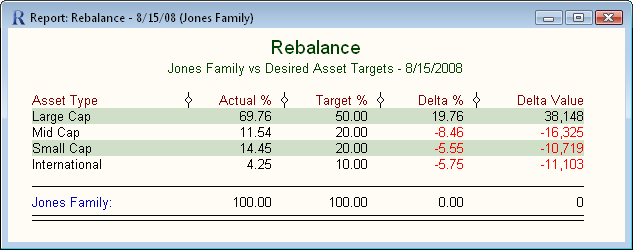
| Rebalance report |
| This report compares your current allocations to specified
targets. Portfolios can be rebalanced against Asset Type,
Investment Goal, Sector, Investment Type, Currency, or a Model
Portfolio. You can
define your own preferred targets. [read more] |
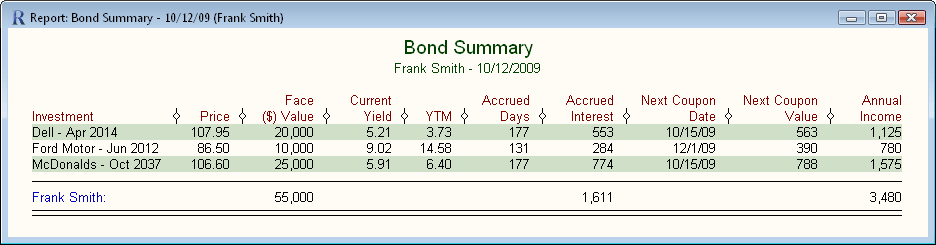
| Bond Summary report |
| This report displays information on your bond investments.
A wide variety of bond related fields are available.
Select your desired report columns under "Options / Report
Preferences... / Bond Summary". [read more] |
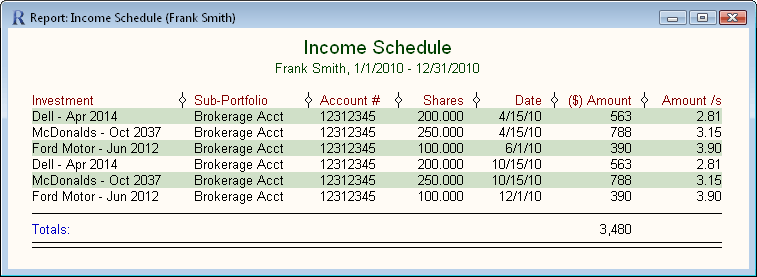
| Income Schedule report |
| This report displays expected interest payments from your
bonds. It can also optionally display scheduled dividend
income. All reports can be sorted by any displayed column,
in either ascending or descending order. This sample
report is sorted by Date. [read more] |
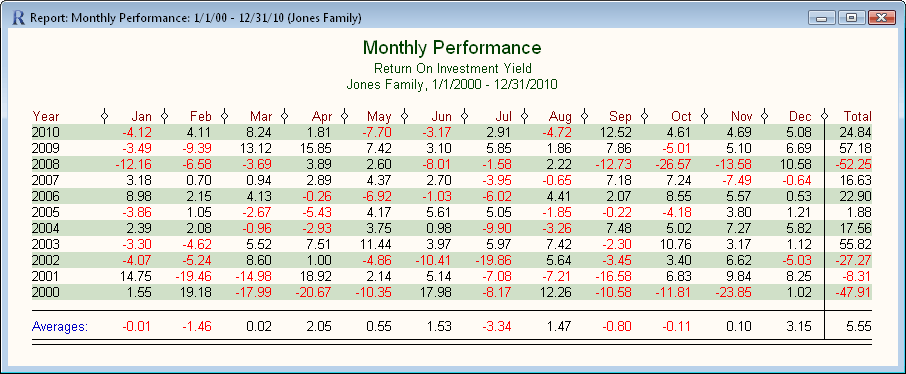
| Monthly Performance report |
| This report gives you insight into how well your invested
money performed each month. The selected performance
metric is reported for the sub-portfolio on a monthly basis.
Totals for each year, and averages are also reported.
Available performance metrics for this report include ROI yield,
Time-Weighted Return (TWR), % Gain, Gain, or Value. [read more] |
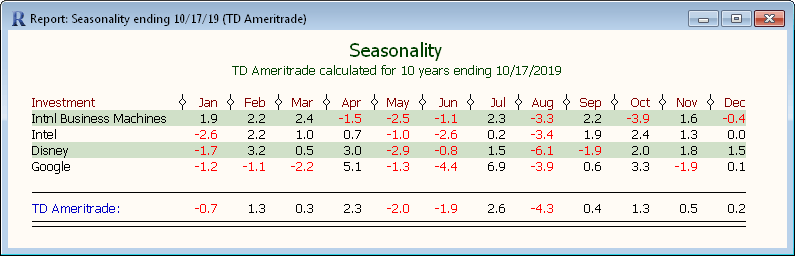
| Seasonality report |
| This report shows the relative performance of investments and portfolios for each month of the calendar year.
The performance is averaged over the specified number of years.
There is also a Seasonality graph.
[read more] |
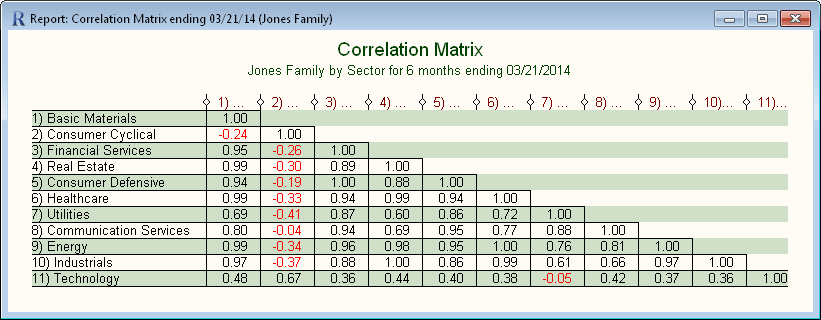
| Correlation Matrix report |
| This report shows a correlation matrix of the monthly
returns between different groups in your portfolio. The matrix
can be displayed for the following groups: Asset Type,
Investment Goal, Sector, Investment Type, or Currency. The
correlation matrix can be calculated for any number of months,
and ending on any date. The correlation coefficients can
vary between -1 and 1. A value of 1 indicates the two
groups are perfectly matched. A value of -1 indicates they
are perfectly matched, but in a negative manner (when one goes
up, the other will go down with the same strength). A
value of 0 indicates there is no relationship between the
groups. [read more] |
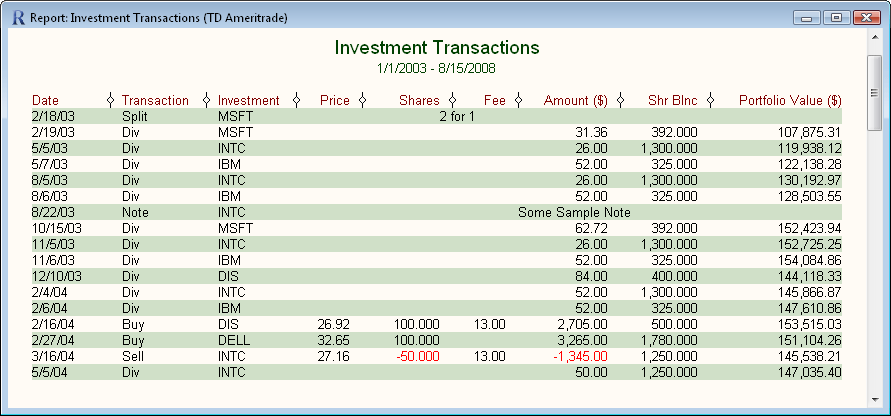
| Investment Transactions report |
| This report displays all of your transactions.
It can be set to display transactions for a particular investment, or all investments
in a particular sub-portfolio. Which columns are displayed
can be customized, and transactions may be filtered. [read more] |

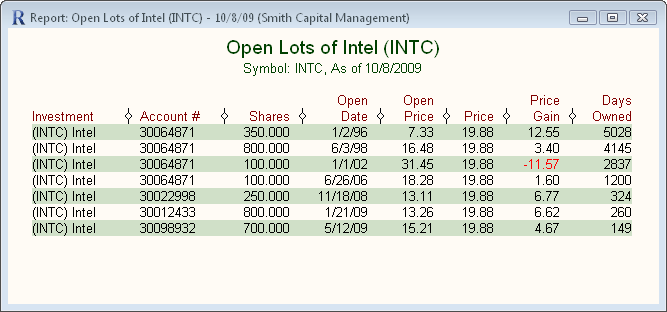
| Filtering Examples |
| Reports in Fund Manager can be listed, filtered, sorted, and
sub-totaled in a wide variety of combinations to get the data
you need. Two examples are shown above. These
reports are showing the total shares of Intel owned by each
client, and then a breakdown of each one of the open lots of
Intel. These reports
can be used by advisors to quickly see how many shares of a
given security are owned by each client. The first report
is a custom report being filtered by the symbol INTC. The
second report is an Open Lots report, also being filtered by the
symbol INTC. The Advisor version also
allows all of the headers to be completely customized, including
support for mail merge fields. This allows client specific
information such as name or tax ID to automatically be inserted
in the report headers. |
|