All graphs are displayed in a "Graphs" window. You can have any number of graph windows open. Each graph window is independent, and displays graphs for its assigned active portfolio.
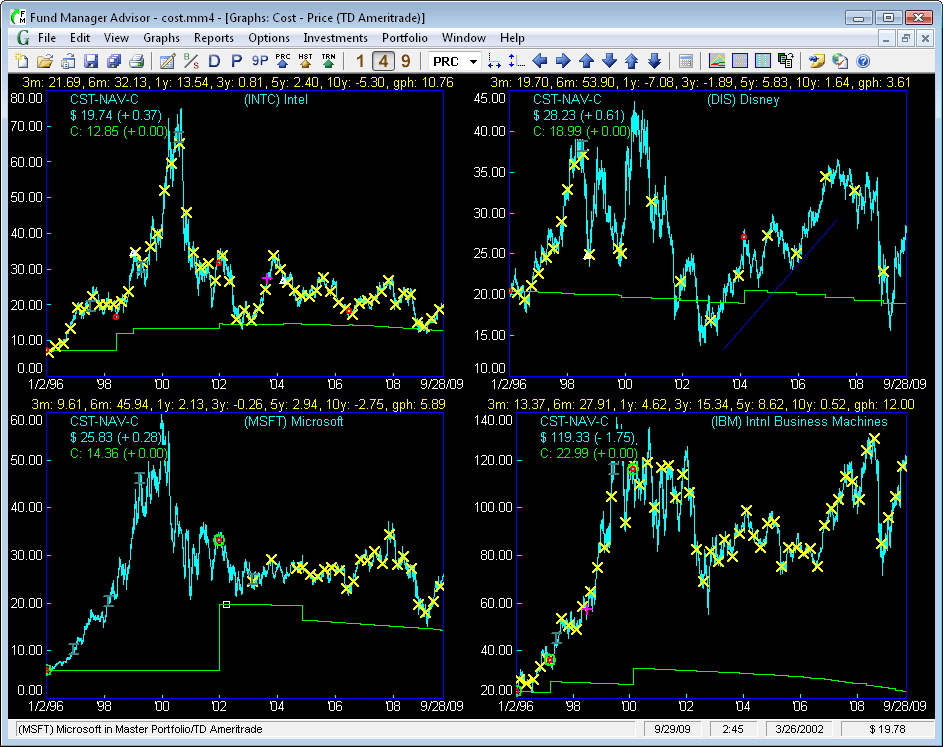
Fund Manager can have many windows open at once. There are 3 different types of top level windows: Graphs, Reports, and the Portfolio Editor. You can use the top level Window menu command to organize, arrange, or select which window(s) to display. An example Graphs window is shown here:

In this example the Cost - Price graph type is selected under the Graphs menu. This is an investment based graph type. There are also many portfolio based graph types. The number of displays is set to 4. You can change this to 1, 4, or 9 with the toolbar buttons (notice 4 is selected now), or under the View / Number of Displays menu. The "legend" is displayed in the upper/left corner of each graph, showing the graph type and the ending share price and cost per share. Yields are being displayed in yellow text above each graph. The share price for this graph type is drawn in light blue, while the out of pocket cost per share is drawn in green. In the title of the window you can see the active portfolio is "TD Ameritrade".
Markers are also being displayed. The yellow X's are distributions. Red circles are purchases. The larger green circles are un-specified lots. The white triangles are redemptions. The dark green capital I (eye) bars are splits, and the purple cross is a note marker. The Disney graph is also displaying a dark blue trendline. Control which markers are displayed with the Options / Markers menu commands. As you move your cursor over any marker, information on that marker will be displayed in the status bar. You can right mouse click on any marker to perform operations on it, such as editing the associated transaction.
The Track Ball cursor is currently on, and you can see the small white box on the cost line in the Microsoft graph on 3/26/2002. The position of this snapped cursor is displayed in the status bar, in the 2 right-most panes. It is displaying the snap position at 3/26/2002 and a cost of $19.78. The current date/time is also displayed in the status bar (9/29/09 at 2:45 in this example).
You can customize the graph type, fonts, colors, date range, vertical scale, display preferences, graph options, or any of several other options available from the menu. Choose which investments are displayed on the investment based graphs under the Investments menu. Set the active portfolio under the Portfolio menu. You can scroll through the investment stack with keyboard shortcuts or the toolbar buttons. You can quickly zoom or pan using keyboard and mouse shortcuts.
Additional graph features are available in the Advisor version. Graphs can be copied as images to the clipboard, for publishing to clients. See Edit / Copy to Clipboard. Graphs (as well as reports) can be emailed to clients using the Send by Email Dialog, or printed in bulk for each client.