|
|
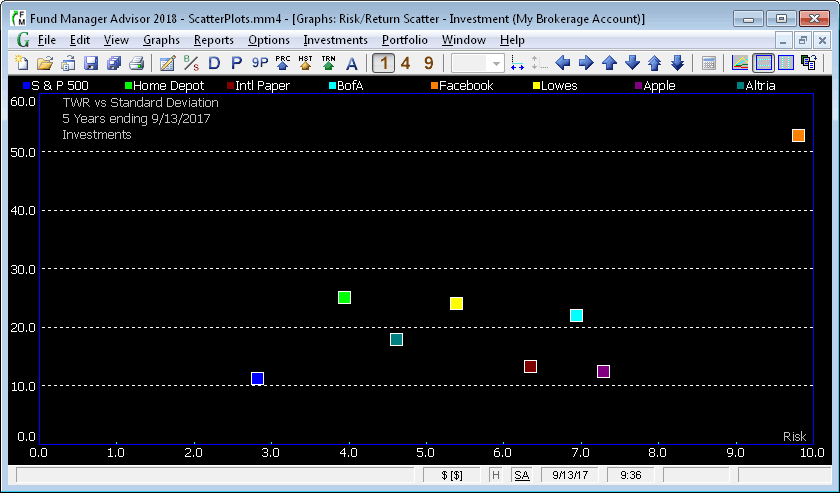
Risk/Reward Scatter PlotsFund
Manager offers scatter plots to analyze risk. These graph
types plot the reward on the Y axis, and the risk on the X axis.
Reward is calculated as Time-Weighted
Return (TWR), and risk is calculated as the
standard deviation of
the monthly returns. These graphs are available for plotting
the risk/reward of investments, asset types, investment goals, symbols,
investment types, or sub-portfolios. You may also overlay any number of indices on these graphs.
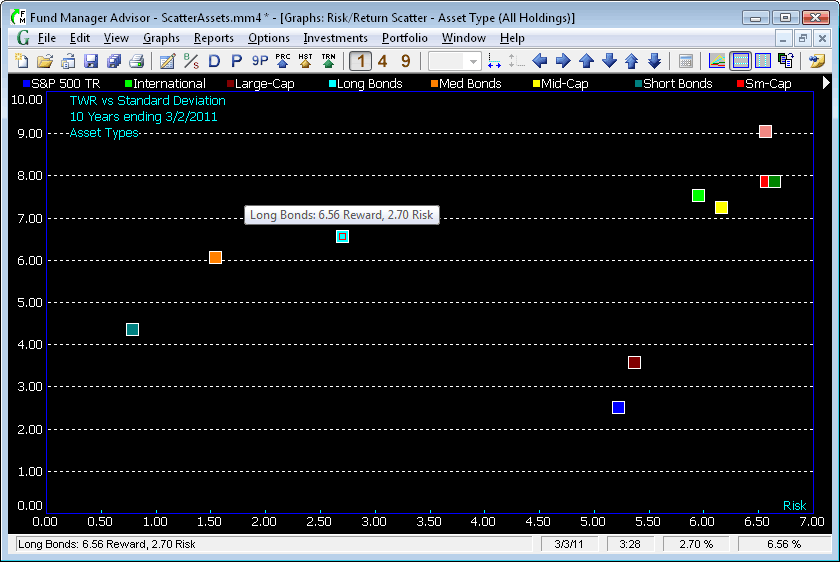
The example graph shown above is for a 10 year comparison period, ending on March 2, 2011. You can see that several of the investments follow the trend of greater return for greater risk, but several other investments were underperforming for the amount of risk being taken. This graph also includes the S&P 500 Total Return for comparison purposes. To get details on any plotted point, hover your cursor over any point and a pop-up window will display detailed information on that point. You can customize the comparison period to be any number of years in the Risk/Reward Options... dialog. This dialog is available by right clicking on the graph, and choosing "Risk/Reward Options..." from the popup menu, or under "Graphs/Options/Risk/Reward Options...". A second sample risk/reward scatter plot is shown below:
This example graph (Risk/Reward Scatter - Asset Type) plots risk/reward for each asset type in your portfolio. The first example was plotting investments, but this example is plotting asset types. This graph can plot investments, asset types, investment goals, symbols, investment types, or sub-portfolios. This graph also shows the pop-up window that is displayed when you hover your cursor over one of the data points. In this example, the cursor was placed over the "Long Bonds" asset type data point. In addition to all the asset types, this graph also includes the S&P 500 index. You can include any number of indices on these graphs. Risk/Reward scatter plots are available in the Professional and Advisor versions of Fund Manager. |
| FundManagerSoftware.com | Search | Site Map | About Us | Privacy Policy |
| Copyright ©1993-2026 Beiley Software, Inc. All rights reserved. |