|
|
Income Schedule Bar ChartsFund
Manager offers "Income Schedule" graph types to plot future
expected income for your portfolio. These graph types plot a bar
chart of expected income versus time. (An equivalent report is
also available in the Income Schedule Report.) The expected income
is calculated from investments with their Income Style property set to
either "Bond Interest" or "Dividends".
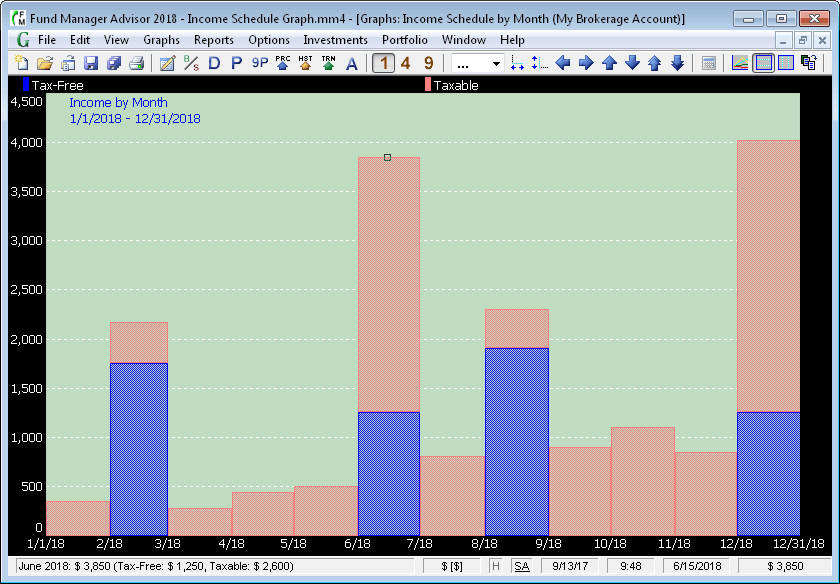
The example graph shown above shows the monthly income for a year, broken down by tax status. To get details on any plotted bar, hover your cursor over the bar and the break down is shown in the status bar. To see details of which investments are providing this income, click on any bar to open up an Income Schedule Report for that time period. In the above example the cursor was over the June 2017 bar, so its details are displayed in the status bar. To choose how the bars are broken down, use the Income Schedule Options... dialog. This dialog is available by right clicking on the graph, and choosing "Income Schedule Options..." from the popup menu, or under "Graphs/Options/Income Schedule Options...". A second sample Income Schedule graph is shown below:
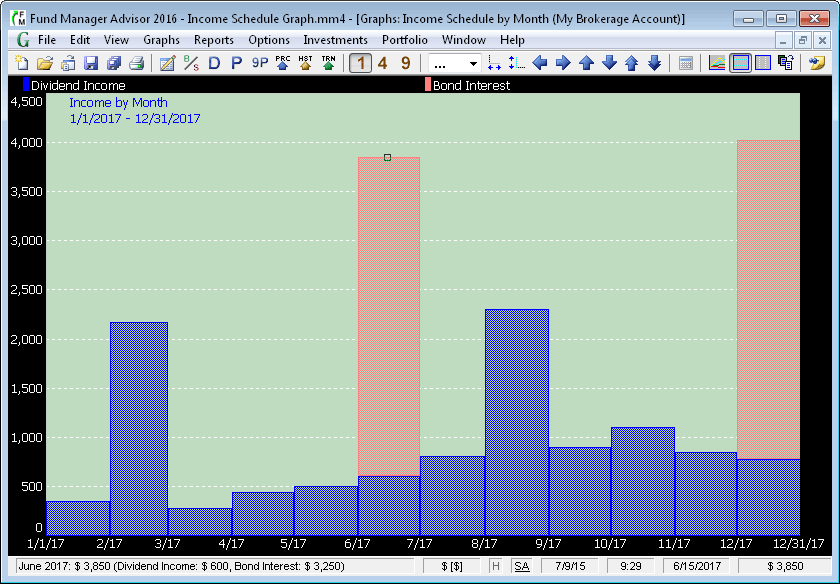
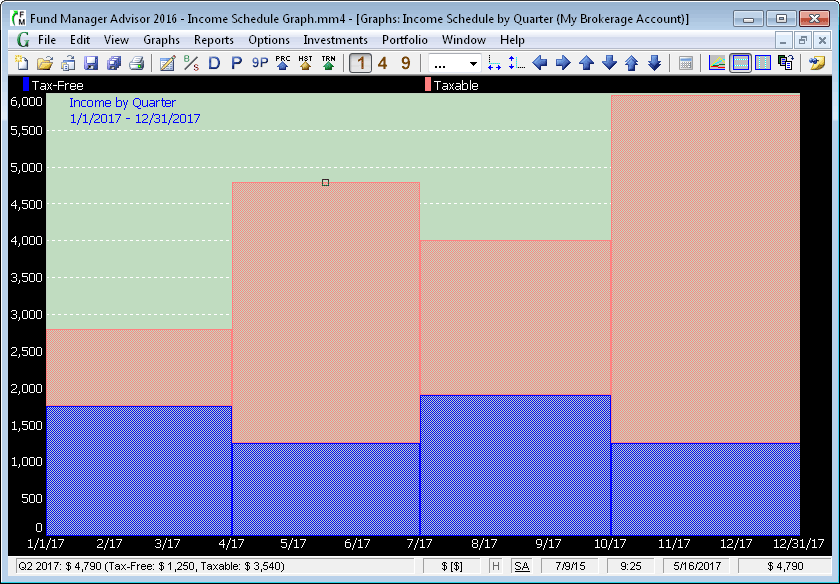
This example graph is similar to the first graph, but shows a break down by income type (Dividend or Bond Interest). The Income Schedule graph can sum income by Month, Quarter, or Year. The following shows an example graph by quarter:
Income Schedule graph are available in all versions of Fund Manager. |
| FundManagerSoftware.com | Search | Site Map | About Us | Privacy Policy |
| Copyright ©1993-2026 Beiley Software, Inc. All rights reserved. |