Hi Mark,
Copy/Paste from various sources:
"Did you know that the stock market tends to fluctuate in regular cycles throughout the year? Such cycles are called seasonality. Individual stocks also have their own seasonality pattern. For example, retail sales tend to be highest toward the end of the year. How would you like the knowledge to know the cycle pattern of specific stocks so you can get in when the stock price is low and sell when the stock price is high? This is seasonality at its most advantageous."
"All commodity futures markets are affected to some extent by an annual seasonal cycle or ‘seasonality’. This cycle of pattern refers to the tendency of market prices to move in a given direction at certain times of the year."
"Seasonality refers to particular time frames when stocks/sectors/indices are subjected to and influenced by recurring tendencies that produce patterns that are apparent in the investment valuation. Tendencies can range from weather events (temperature in winter vs. summer, probability of inclement conditions, etc.) to calendar events (quarterly reporting expectations, announcements, etc.). The key is that the tendency is recurring and provides a sustainable probability of performing in a manner consistent to previous results."
Article in Investopedia: https://www.investopedia.com/terms/s/seasonality.asp
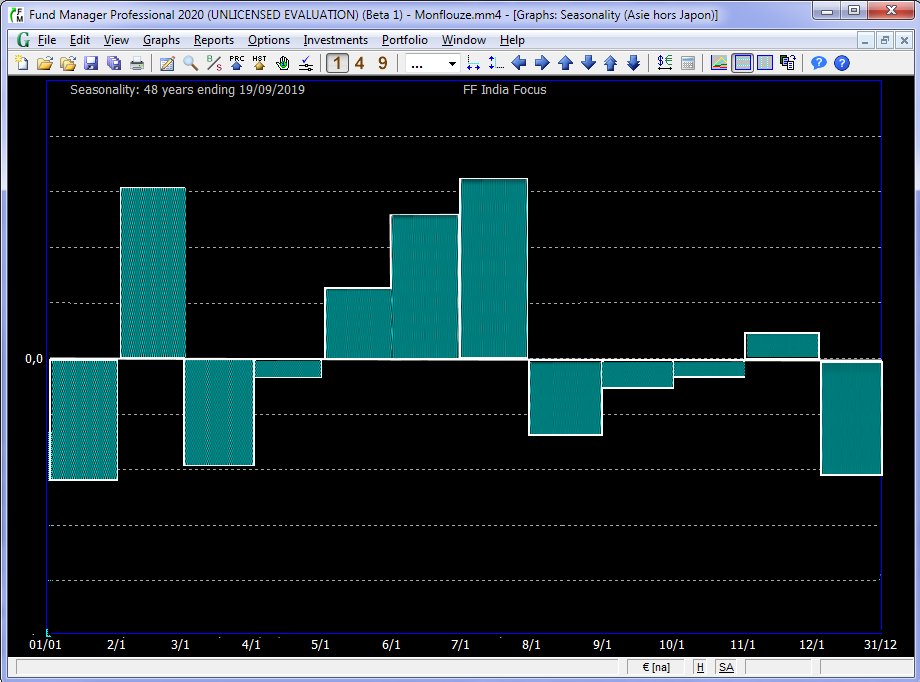
Annual seasonality is represented with a graph or a report (average returns calculated from a date range of XX years, the more the better).
Typical seasonal graph and report on this page (a good blog with a lot of seasonal data):
http://charts.equityclock.com/corn-futu ... onal-chart
A charts is more detailed than a report. In a report, a single return value for each month. In a graph, we have the curve with intermediate return values.
Be able to have seasonal report and graph in Fund Manager would be awesome!
A report for this would be already great. A graph, top notch.
|
|
Seasonality features
32 posts
• Page 1 of 3 • 1, 2, 3
Thanks very much for the addition of seasonality features in FM 2020, currently at beta stage. These are very powerful.
I have two questions and some feedback on this area. For sure I'm not an expert, I will maybe suggest some irrelevant things here. 1) The calculation periods (in years) are allowed to exceed the historical price availability. For example, if an investment has 10 years of historical prices, we can calculate seasonality for 20 years, or 40 years if we want. Just to be sure, on this example selecting between 20 years or 40 years has not consequence on the reliability of the results, right? On the relative values that is the same, is this right? 2) In the Seasonality report, does the sub-total line makes sense / is sometimes calculated? For me it always return N/A (even if all investments in the selected subporfolio are correcty calculated) 3) Based around 0 / Based around 100 From the Help, topic Seasonality, it is written: "The return values used in the calculation are based around 100. For example, a 5% TWR will be represented as 105, where a -5% TWR will be represented as 95." This Seasonality topic in the help exposes general concepts that apply to seasonality graphs AND reports, right? But for the reports the return values used in the calculation are based around 0. Seasonality graphs are indeed 100 based. I think that discrepancy between report and graph may be confusing. 4) Overall, I find the seasonality graphs are hard to read / to understand, due to based around 100 and some other factors. An idea is that the visibility could be much better with graphs based around 0. Base around 0 is more intuitive: below zero = below the average return, over zero = over the average return. And this would be consistent with reports. I made a quick mockup to illustrate the better visibility of a graph based around 0: https://i.postimg.cc/25fV6Xyr/20190921-sam-15h40-01.png In addition, maybe bars under zero could be red filled, and bars above zero blue filled. 5) Seasonality Graph - Line display I'm not convinced by this line display! Sorry but it find it unusable. Starting from the mockup above, what about this line display instead: https://i.postimg.cc/N0JF4Gbf/20190921-sam-16h51-01.png This line instead looks much more useful (IMO), and there could be three options for the display: bar only | line only | bar + line. Again, I'm not an expert, some suggestions may be impractical.
Hi Djobydjoba,
The Seasonality calculations utilize your Yield Interpolation Range... settings for TWR calculations. If you have "Allow interpolation prior to first data", then it will calculate for longer than you have data. Generally you don't want to leave that option on, and it defaults off.
Yes, it is the Seasonality of your sub-portfolio, which can be calculated just like for an investment. If you're getting N/A, look at "Help / Logs / Report Calculation..." for an explanation.
The numbers are calculated the same for graphs/reports, but just offset by 100 so that they are 0 based when in a report. I do understand your point about it possibly being confusing.
I like the one where the graph is 0 based for bars, and plotting the negative one's red is a good idea too. We'll give it some thought...
Hi Mark,
And what do you think of this way to display line? Last edited by Djobydjoba on Sun Sep 22, 2019 5:28 am, edited 1 time in total.
The definition / calculation for seasonality that has been chosen in FM 2020 beta is:
the average return for each calendar period divided by the overall average return, over the specified number of years. This is an interesting approach. But there is the more common approach (AFAIK) that is: the average return for each calendar period over the specified number of years. and this common approach is very straightforward, easy to understand. And it shows meaningful returns (absolute returns, not relative to an average). I guess many users will look for this approach in the first place (as I did in fact). So confusion may be expected here. With the current FM approach, we will miss these useful figures "average returns for each calendar period". (there is the Monthly Performance report, but it only shows (in the sub-total) average monthly returns for the current portfolio, and not for individual investments. And of course it doesn't provide weekly or quarterly returns.) Please consider the "average return for each calendar period" approach, it is simpler and could be more beneficial.
Hi Djobydjoba,
I don't like it as much as the way the line mode works today. The current line mode is technically more accurate, than drawing from mid-point to mid-point the way this example shows. In the current method all the plotted data points are showing the correct values on all the dates.
Hi Djobydjoba,
In our research, Seasonality is normally calculated how FM is doing it. I'm not sure there is one absolute right way to do this. Both these methods will give the same seasonality "profile", but FM's method will be normalized, so the amount of seasonality between different investments/portfolios can be noticed easier. Making an option to do the calculation without dividing by the average would probably be quite easy, so we can give this some time, and consider adding this as a future option. I realize it isn't ideal, but if you wanted to see the raw averages before being normalized, they are available in the seasonality_log.txt log file. You can turn this on via a registry option. See the online help (Seasonality Definition) for instructions.
Hi Mark,
To resolve the accuracy problem of the line the units of the X-Axis should be the period. For example, if period = month, the X axis should be divided by months only, and I should not be possible to navigate day by day along the X Axis, only month by month. For example, a graph by month with an accurate line: https://i.postimg.cc/vHT651pM/20190923-lun-20h42-02.png The fact that the X-Axis cannot be divided per week, month or quarter prevent to draw a line. Sorry again but the current implementation of the line is not good. It's not even a line. It's only segments. It is bar display without the vertical lines, so it's a pain to retrieve visually the value of the X-Axis. It's only look like a random cloud of segments. The problem comes from the limitations of X-Axis. IMHO the current line option should be removed and a division of the X-Axis per week / month / quarter implemented, to be able to draw a true line.
Hi Djobydjoba,
Okay, thanks for the feedback. I can give it some thought. We might rename "Line" to "Segment" display or something. It is just one display option, so you can use the default of "Bar" if you prefer it.
Yes of course, I'll use bar, no big deal.
Indeed it's the benefit of this method. The drawback is that it is relative returns. Investors look for absolute returns above all.
yes, probably.
Hi Mark,
1) In a seasonality graph, right click > Seasonality Graph Options, we may want to play repeatedly with the Years field, selecting different data ranges and see what are the results. If we select to much years, this can lead to the msg on the center of the graph : "Unable to calculate seasonality", and then it is not possible anymore to right click and select another years number to correct this. We have now to go to Graphs > Options > Seasonality Options to correct the years field. This is not very ergonomics, and perhaps the ability to still access Seasonality Graph Options with a right click on the graph should be left. 2) Related to 1), it would be nice for the Seasonality Graph Options > Years field, if there could be an "auto" mode, where the number of years is determined automatically for each investment, depending on the historical prices available (with the goal to always to use all the data available but not more, for no interpolation). In the Seasonality report we could think of this "Auto" mode too. 2) In the seasonality report, I would find useful the ability to filter, especially on investment types. Because in my portfolios I have several investment types (indexes, mutual funds, spreads, yields...), and some of them have negative prices (spreads, yields). So with the inability to filter I'll never have a sub-total calculated for the report, because there will always be a calculation error for one or several investments.
Hi Djobydjoba,
1) Thanks, we will fix this so the menu displays even if it wasn't able to draw the graph. 2) Nice idea. 2b) That would be a good improvement. BTW, negative valued investments in a portfolio will not prevent TWR from being calculated. As long as your overall portfolio value remains positive over the yield term, a TWR can be calculated for the portfolio.
Hi Djobydjoba,
We have added a global option to control whether Seasonality is normalized (divided by the average return) or not. It will be in the next release under "General Preferences... / Other / Seasonality Values are Normalized". When it isn't normalized it is simply the average return for the period.
32 posts
• Page 1 of 3 • 1, 2, 3
Who is onlineUsers browsing this forum: No registered users and 13 guests |
| FundManagerSoftware.com | Search | Site Map | About Us | Privacy Policy |
| Copyright © 1993-2024 Beiley Software, Inc. All rights reserved. |